Market Outlook
May 04, 2017
Market Cues
Domestic Indices
Chg (%)
(Pts)
(Close)
Indian markets are likely to remain flat tracking the SGX Nifty & global cues.
BSE Sensex
(0.1)
(26)
29,895
After spending much of the day in negative territory, the major US markets ended
Nifty
(0.0)
(2)
9,312
Wednesdays trading mixed following the Federal Reserves monetary policy
Mid Cap
(0.3)
(45)
14,810
announcement. While the Dow managed to creep into positive territory, the Nasdaq
Small Cap
0.1
110
15,431
pulled back off yesterdays record closing high. The mixed close by the major
averages came following the Federal Reserves widely expected decision to leave
Bankex
(0.4)
(95)
25,246
interest rates unchanged.
The European markets ended Wednesdays session with mixed results. Investors
Global Indices
Chg (%)
(Pts)
(Close)
remained cautious ahead of policy decision from the Federal Reserve. The Fed is
Dow Jones
0.0
178
20,958
widely expected to leave rates unchanged, but investors kept an eye out for clues
Nasdaq
(0.4)
(23)
6,073
regarding future rate hikes. Traders are also looking forward to the release of the
FTSE
(0.2)
(16)
7,235
U.S. jobs report for April on Friday.
Nikkei
(00.7
135
19,446
Indian markets ended a lackluster session largely unchanged on Wednesday as
Hang Seng
0.3
281
24,696
investors awaited a televised debate between France's presidential rivals and the
Shanghai Com
(0.3)
(8)
3,135
U.S. Federal Reserves rate decision.
Result Review
Advances / Declines
BSE
NSE
Alembic Pharma 4QFY17
Advances
1,322
1,751
Detailed analysis on Pg2
Declines
1,543
944
Unchanged
159
74
Investor’s Ready Reckoner
Key Domestic & Global Indicators
Volumes (` Cr)
Stock Watch: Latest investment recommendations on 150+ stocks
Refer Pg6 onwards
BSE
4,236
NSE
25,272
Top Picks
CMP
Target
Upside
Company
Sector
Rating
(`)
(`)
(%)
#Net Inflows (` Cr)
Net
Mtd
Ytd
Blue Star
Capital Goods
Accumulate
681
760
11.6
FII
(5(333)
(2(333)
41,679
Dewan Housing Fin. Financials
Buy
444
520
17.0
MFs
8258
9,918
19,355
Mahindra Lifespace Real Estate
Accumulate
472
522
10.7
Navkar Corporation Others
Buy
215
265
23.3
Top Gainers
Price (`)
Chg (%)
KEI Industries
Capital Goods
Accumulate
216
239
10.3
More Top Picks on Pg4
Intellect
139
10.8
Sreinfra
103
9.6
Key Upcoming Events
Previous
Consensus
Raymond
783
8.1
Date
Region
Event Description
Reading
Expectations
Godrejprop
544
7.7
May 04, 2017 Euro Zone Euro-Zone GDP s.a. (QoQ)
0.50
0.50
Ptc
103
6.7
May 04, 2017 Germany PMI Services
54.70
54.70
May 05, 2017 China
Exports YoY%
16.40
10.00
May 05, 2017 US
Change in Nonfarm payrolls
98.00
190.00
Top Losers
Price (`)
Chg (%)
May 08, 2017 US
Unnemployment rate
4.50
4.60
Biocon
1,033
(5.0)
May 10, 2017 China
Consumer Price Index (YoY)
0.90
1.10
Adanipower
31
(4.8)
More Events on Pg5
Suntv
881
(4.6)
Amtekauto
38
(4.4)
Ipcalab
563
(4.3)
#As on May 03, 2017
Market Outlook
May 04, 2017
News Analysis
Alembic Pharmaceuticals (CMP:
`619
/ TP:
`689
/ Upside:
11.3%)
The company posted 4QFY2017 results marginally lower than expected. In rupee
terms, revenues grew by 17.8% yoy to `737cr V/s `770cr expected V/s `626cr in
4QFY2016. In sales term, the company posted growth of back of the international
formulations, which grew by 44% yoy, while the Indian domestic formulations,
grew by 6.0% yoy. API business on the other hand posted a yoy growth of 9.0%. In
domestic formulation specialty business, which formulated around 58% of the
domestic sales grew by 13.0% yoy, while acute segment which constituted around
33% of domestic formulations, dipped by 8%. The Veterinary segment which
constituted around 9% of domestic formulations, posted a yoy growth of 13.0%. In
International formulation business, US formulation business grew by 54% yoy.
On the operating front, EBITDA margin came in at 18.2% V/s 19.9% expected V/s
22.7% in 4QFY2016, a dip of 460ps qoq. The dip was mainly on back of lower
gross margins, which came in at 72.8% V/s 80.2% in 4QFY2016. Thus, PAT came
in at `93.04cr V/s `101.0cr expected V/s `91.2cr in 4QFY2016, up 2.1% yoy
Given the valuations, we maintain accumulate rating with target price of `689.
Economic and Political News
Cabinet clears ordinance to amend Banking Act to tackle NPAs
Cabinet clears new steel policy, envisages investments of `10 lakh cr.
US votes to extend anti-dumping duty on Indian shrimps for 5 years
Black money routed into gold market, shell cos after note ban: I-T sleuths
Sri Lanka to go ahead with strategic oil facility deal with India
Corporate News
L&T Technology Services to buy Silicon Valley-based firm for `180cr
Mahindra pulls the plug on electric car sales in UK
Godrej Properties sells 1,000 apartments across 3 new projects
Market Outlook
May 04, 2017
Quarterly Bloomberg Brokers Consensus Estimate
Exide Industries Ltd - May 4, 2017
Particulars ( ` cr)
4QFY17E
4QFY16
y-o-y (%)
3QFY17
q-o-q (%)
Net sales
1,969
1,756
12.1
1,725
14.1
EBITDA
287
267
7.2
230
24.9
EBITDA margin (%)
14.6
15.2
13.3
Net profit
178
178
0.4
151
17.6
Housing Development Finance Corp - May 4, 2017
Particulars ( ` cr)
4QFY17E
4QFY16
y-o-y (%)
3QFY17
q-o-q (%)
Net profit
2,020
2,607
(22.5)
1,701
18.7
Bharti Infratel Consol - May 8, 2017
Particulars ( ` cr)
4QFY17E
4QFY16
y-o-y (%)
3QFY17
q-o-q (%)
Net sales
3,486
3,162
10.3
1,530
127.8
EBITDA
1,540
1,425
8.1
706
118.3
EBITDA margin (%)
44.2
45.1
46.1
Net profit
700
662
5.8
620
12.9
ABB India Ltd - May 8, 2017
Particulars ( ` cr)
1QCY17E
1QCY16
y-o-y (%)
4QCY16
q-o-q (%)
Net sales
2,224
1,976
12.5
2,441
(8.9)
EBITDA
195
149
30.5
282
(31.0)
EBITDA margin (%)
8.7
7.5
11.5
Net profit
92
71
29.8
147
(37.3)
Market Outlook
May 04, 2017
Top Picks ★★★★★
Market Cap
CMP
Target
Upside
Company
Rationale
(` Cr)
(`)
(`)
(%)
Strong growth in domestic business due to its leadership
in acute therapeutic segment. Alkem expects to launch
Alkem Laboratories
23,800
1,991
2,257
13.4
more products in USA, which bodes for its international
business.
We expect the company would report strong profitability
Asian Granito
1,164
387
405
4.7
owing to better product mix, higher B2C sales and
amalgamation synergy..
Favourable outlook for the AC industry to augur well for
Cooling products business which is out pacing the market
Blue Star
6,507
681
760
11.6
growth. EMPPAC division's profitability to improve once
operating environment turns around..
With a focus on the low and medium income (LMI)
consumer segment, the company has increased its
Dewan Housing Finance
13,916
444
520
17.0
presence in tier-II & III cities where the growth opportunity
is immense.
Strong loan growth backed by diversified loan portfolio
and adequate CAR. ROE & ROA likely to remain decent
Equitas Holdings
5,468
162
235
45.2
as risk of dilution remains low. Attractive valuations
considering growth.
Economic recovery to have favourable impact on
advertising & circulation revenue growth. Further, the
Jagran Prakashan
6,406
196
225
14.8
acquisition of a radio business (Radio City) would also
boost the company's revenue growth.
High order book execution in EPC segment, rising B2C
KEI Industries
1,682
216
239
10.3
sales and higher exports to boost the revenues and
profitability
Speedier execution and speedier sales, strong revenue
Mahindra Lifespace
1,936
472
522
10.7
visibilty in short-to-long run, attractive valuations
Massive capacity expansion along with rail advantage at
Navkar Corporation
3,065
215
265
23.3
ICD as well CFS augurs well for the company
Strong brands and distribution network would boost
Siyaram Silk Mills
1,590
1,696
1,872
10.4
growth going ahead. Stock currently trades at an
inexpensive valuation.
Market leadership in Hindi news genre and no.
2
viewership ranking in English news genre, exit from the
TV Today Network
1,589
266
344
29.1
radio business, and anticipated growth in ad spends by
corporates to benefit the stock.
Source: Company, Angel Research
Market Outlook
May 04, 2017
Key Upcoming Events
Result Calendar
Date
Company
May 4, 2017
Exide Industries, Bank of Maharashtra, MRF
May 5, 2017
Apollo Tyres, Visaka Industries, Aventis
May 6, 2017
L G Balakrishnan & Bros
Source: Bloomberg, Angel Research
Global economic events release calendar
Date
Time
Country
Event Description
Unit
Period
Bloomberg Data
Last Reported Estimated
May 4,, 2017 2:30PM Euro Zone
Euro-Zone GDP s.a. (QoQ)
% Change
1Q A
0.50
0.50
1:25PM Germany
PMI Services
Value
Apr F
54.70
54.70
May 5,, 2017
China
Exports YoY%
% Change
Apr
16.40
10.00
6:00PM US
Change in Nonfarm payrolls
Thousands
Apr
98.00
190.00
May 8,, 2017 6:00PM US
Unnemployment rate
%
Apr
4.50
4.60
May 10, 2017 7:00AM China
Consumer Price Index (YoY)
% Change
Apr
0.90
1.10
India
Imports YoY%
% Change
Apr
45.30
--
India
Exports YoY%
% Change
Apr
27.60
--
May 11, 2017
US
Producer Price Index (mom)
% Change
Apr
(0.20)
--
2:00PM UK
Industrial Production (YoY)
% Change
Mar
2.80
--
4:30PM UK
BOE Announces rates
% Ratio
May 11
0.25
--
May 12, 2017 5:30PM India
Industrial Production YoY
% Change
Mar
(1.20)
--
6:00PM US
Consumer price index (mom)
% Change
Apr
(0.30)
0.30
11:30AM Germany
GDP nsa (YoY)
% Change
1Q P
1.20
--
May 15, 2017 7:30AM China
Industrial Production (YoY)
% Change
Apr
7.60
7.00
12:00PM India
Monthly Wholesale Prices YoY%
% Change
Apr
5.70
--
May 16, 2017 6:00PM US
Housing Starts
Thousands
Apr
1,215.00
--
6:00PM US
Building permits
Thousands
Apr
1,267.00
--
6:45PM US
Industrial Production
%
Apr
0.55
--
2:00PM UK
CPI (YoY)
% Change
Apr
2.30
--
May 17, 2017 2:30PM Euro Zone
Euro-Zone CPI (YoY)
%
Apr F
1.90
--
2:00PM UK
Jobless claims change
% Change
Apr
25.50
--
May 19, 2017 7:30PM Euro Zone
Euro-Zone Consumer Confidence
Value
May A
(3.60)
--
May 23, 2017 7:30PM US
New home sales
Thousands
Apr
621.00
--
May 24, 2017 7:30PM US
Existing home sales
Million
Apr
5.71
--
2:00PM UK
GDP (YoY)
% Change
1Q P
2.10
--
Source: Bloomberg, Angel Research
Market Outlook
May 04, 2017
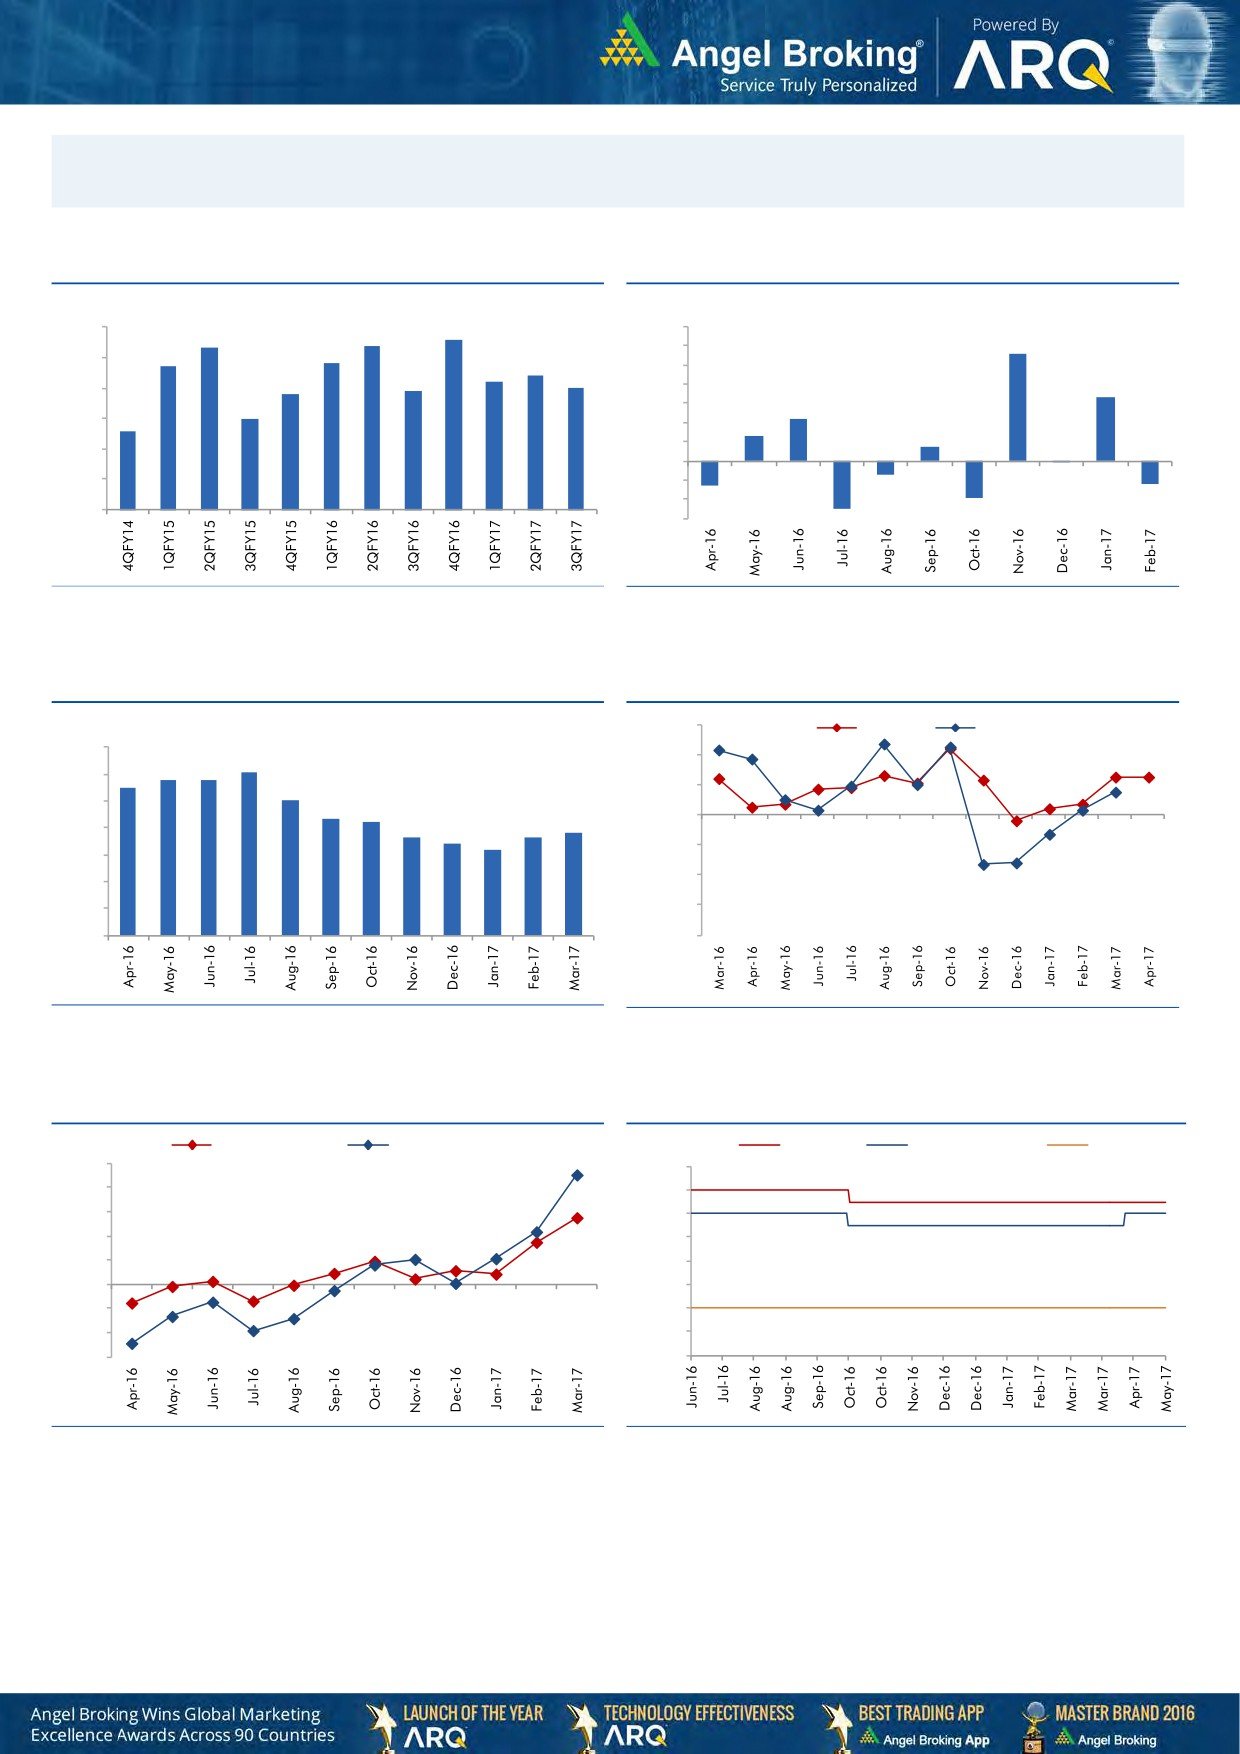
Macro watch
Exhibit 1: Quarterly GDP trends
Exhibit 2: IIP trends
(%)
(%)
8.6
9.0
8.3
8.4
7.0
5.6
7.7
7.8
6.0
8.0
7.4
7.2
5.0
6.9
7.0
6.8
3.3
7.0
4.0
6.0
3.0
2.2
5.6
6.0
2.0
1.3
0.7
1.0
5.0
-
4.0
(1.0)
(0.1)
(0.7)
(2.0)
(1.3)
(1.2)
3.0
(3.0)
(1.9)
(2.5)
Source: CSO, Angel Research
Source: MOSPI, Angel Research
Exhibit 3: Monthly CPI inflation trends
Exhibit 4: Manufacturing and services PMI
(%)
56.0
Mfg. PMI
Services PMI
7.0
6.1
54.0
5.8
5.8
6.0
5.5
5.1
52.0
5.0
4.3
4.2
3.7
3.8
50.0
4.0
3.6
3.4
3.2
48.0
3.0
46.0
2.0
1.0
44.0
-
42.0
Source: MOSPI, Angel Research
Source: Market, Angel Research; Note: Level above 50 indicates expansion
Exhibit 5: Exports and imports growth trends
Exhibit 6: Key policy rates
(%)
Exports yoy growth
Imports yoy growth
(%)
Repo rate
Reverse Repo rate
CRR
50.0
7.00
40.0
6.50
30.0
6.00
20.0
5.50
10.0
5.00
0.0
4.50
(10.0)
4.00
(20.0)
3.50
(30.0)
3.00
Source: Bloomberg, Angel Research
Source: RBI, Angel Research
Market Outlook
May 04, 2017
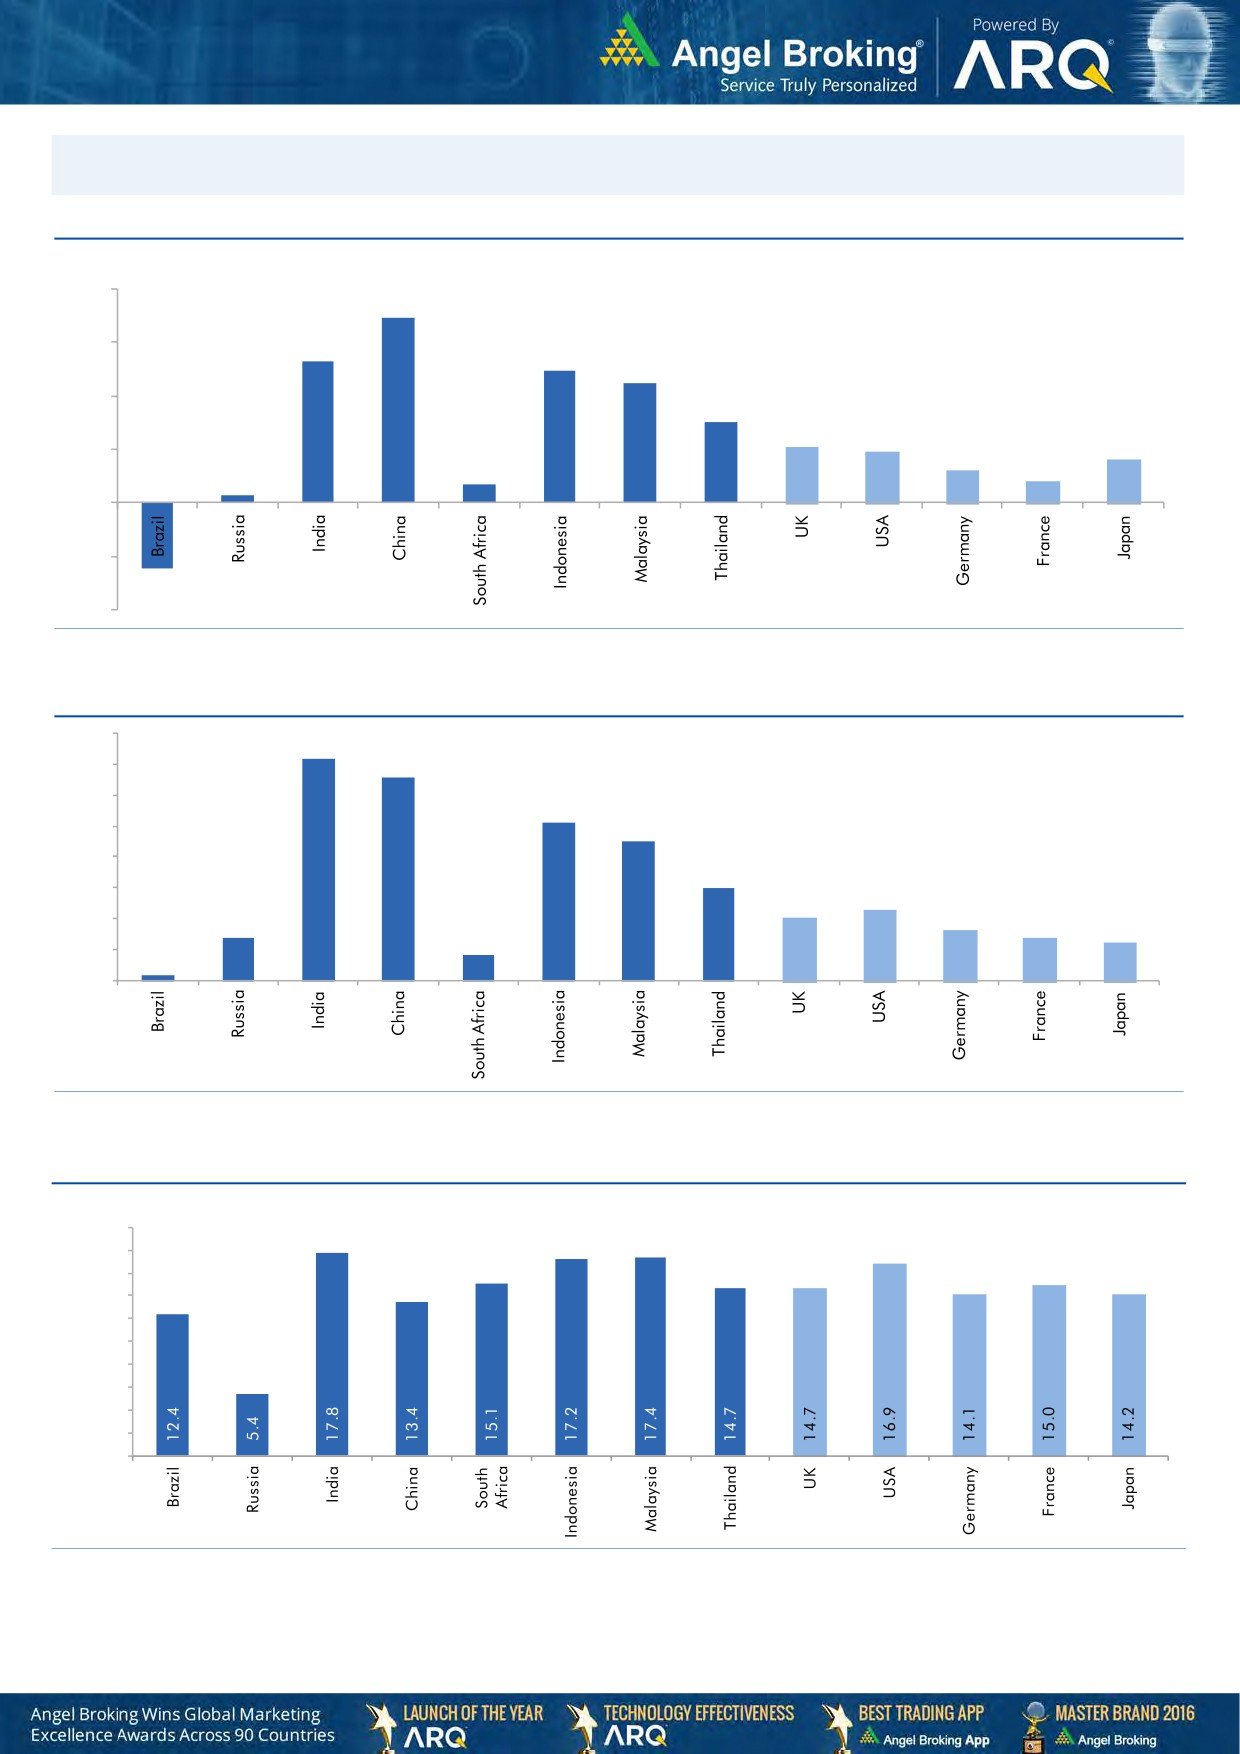
Global watch
Exhibit 1: Latest quarterly GDP Growth (%, yoy) across select developing and developed countries
(%)
8.0
6.9
6.0
5.3
4.9
0.7
4.5
4.0
3.0
2.1
1.9
2.0
0.3
1.6
1.2
0.8
-
(2.0)
(2.5)
(4.0)
Source: Bloomberg, Angel Research
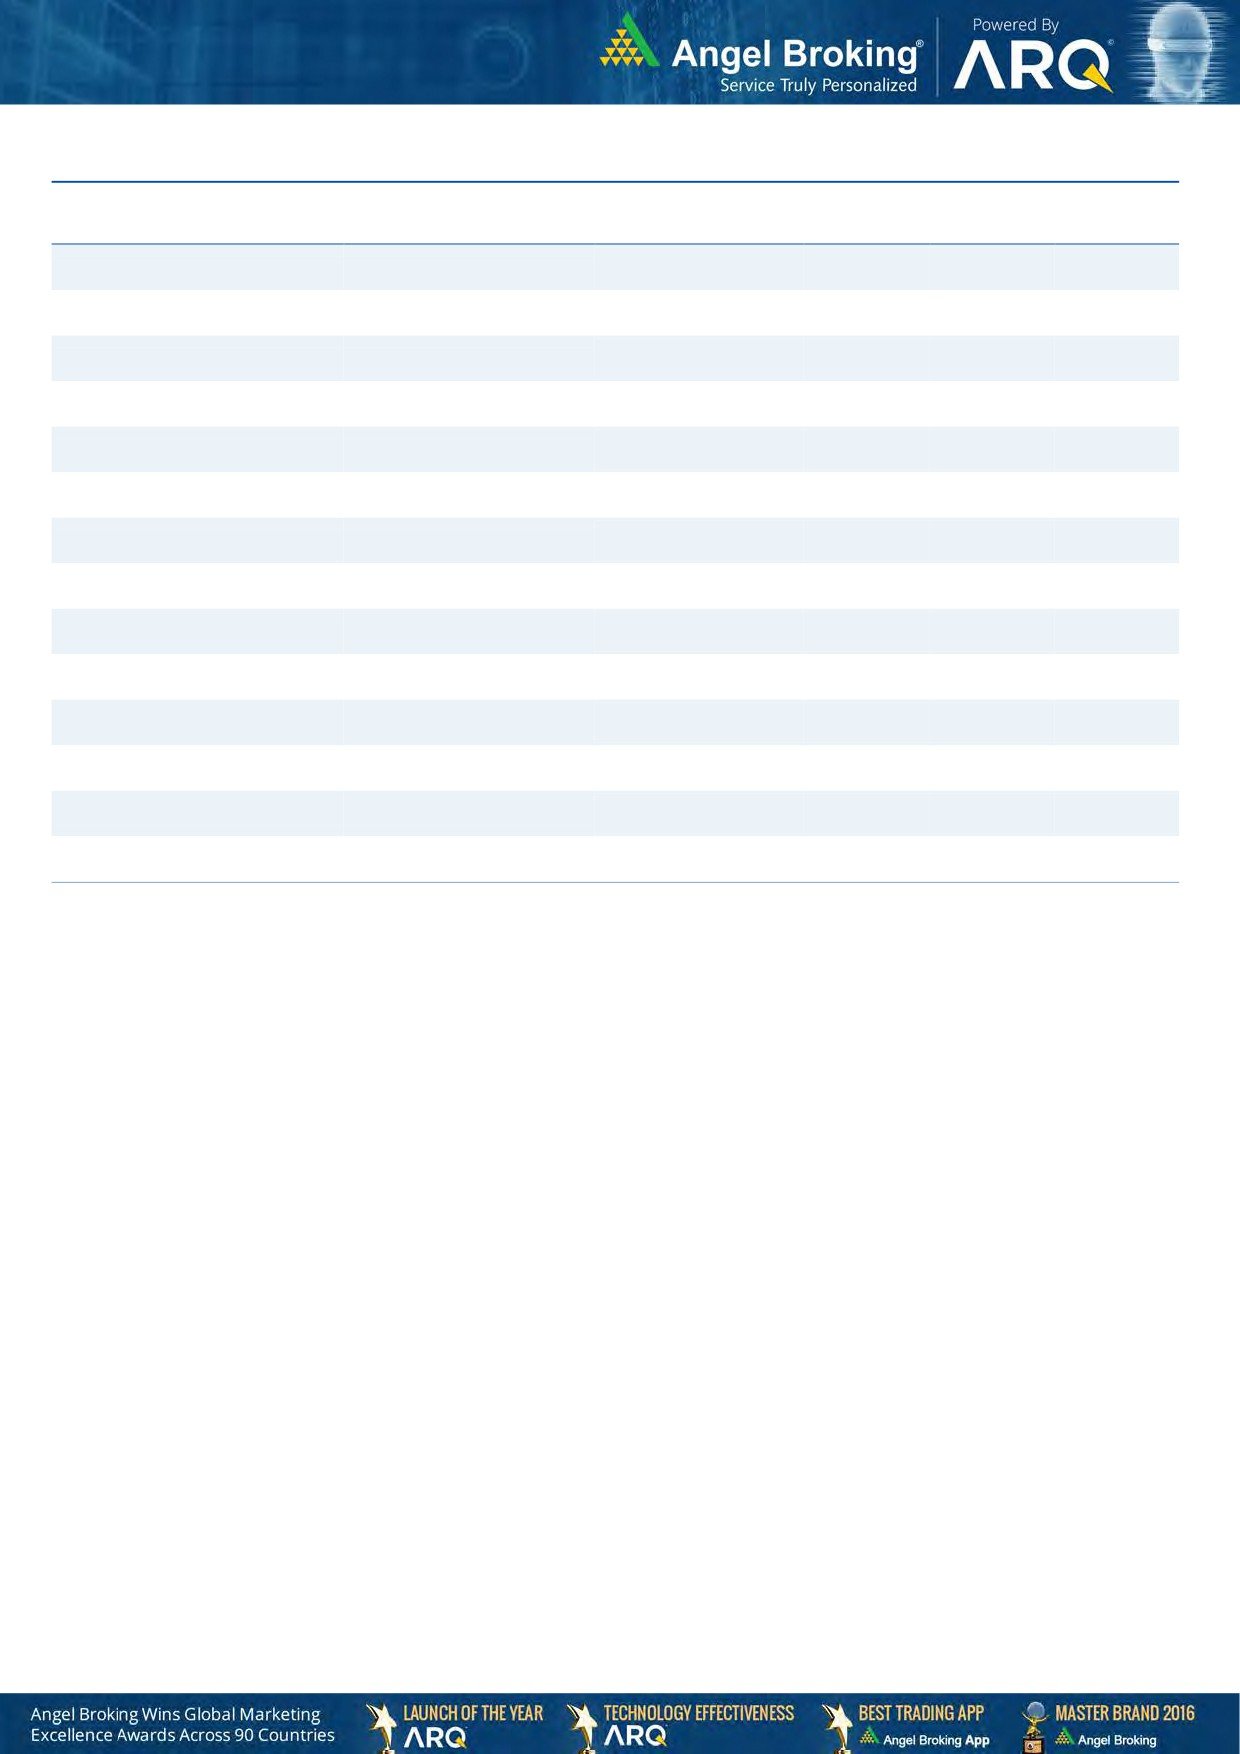
Exhibit 2: 2016 GDP Growth projection by IMF (%, yoy) across select developing and developed countries
(%)
7.2
6.6
7.0
6.0
5.1
5.0
4.5
4.0
3.0
3.0
2.3
2.0
1.4
1.6
2.0
1.4
1.2
0.2
0.8
1.0
-
Source: IMF, Angel Research
Exhibit 3: One year forward P-E ratio across select developing and developed countries
(x)
20.0
18.0
16.0
14.0
12.0
10.0
8.0
6.0
4.0
2.0
-
Source: IMF, Angel Research
Market Outlook
May 04, 2017
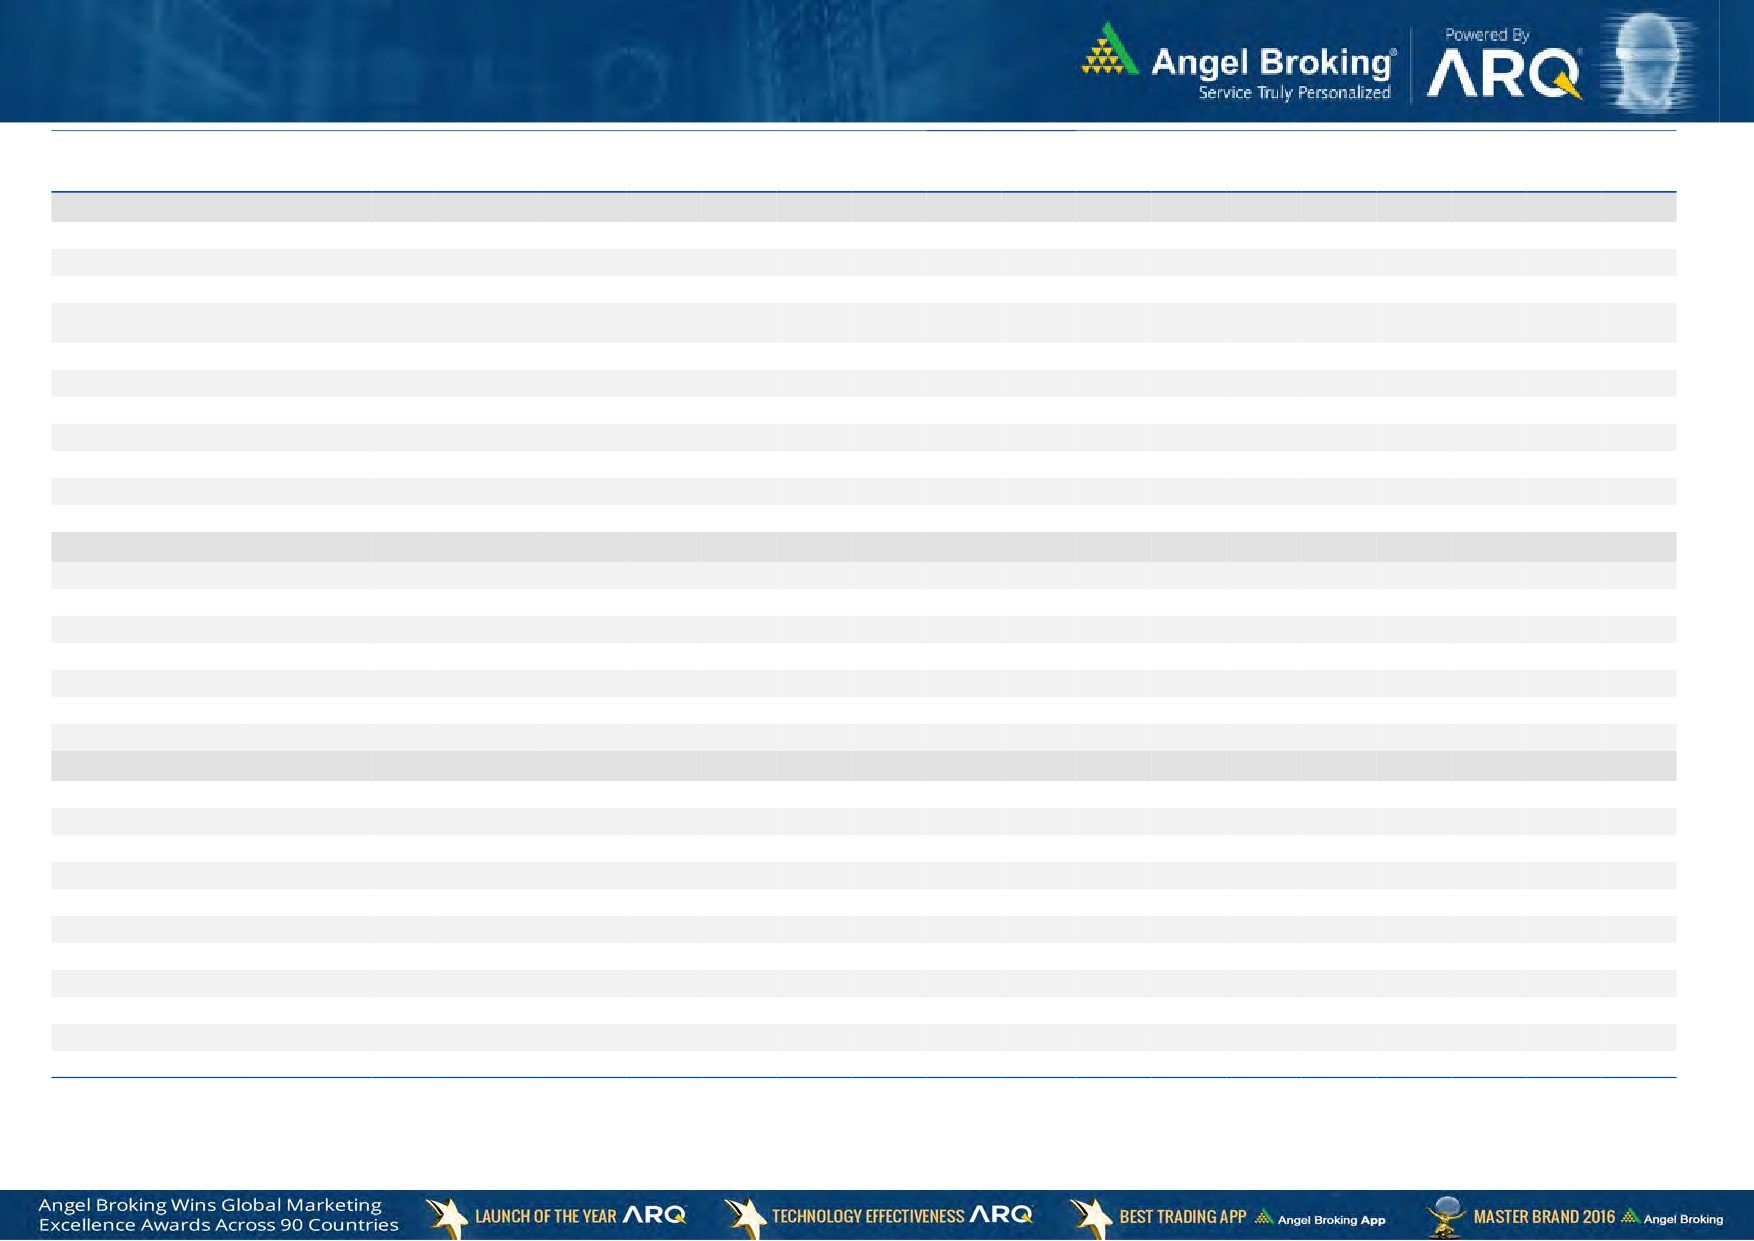
Exhibit 4: Relative performance of indices across globe
Returns (%)
Country
Name of index
Closing price
1M
3M
1YR
Brazil
Bovespa
66,094
0.9
(0.1)
22.6
Russia
Micex
1,994
(0.1)
(10.8)
4.8
India
Nifty
9,312
1.8
8.2
18.7
China
Shanghai Composite
3,135
(2.8)
(0.7)
5.7
South Africa
Top 40
46,918
3.8
0.9
0.3
Mexico
Mexbol
49,100
0.1
3.1
8.3
Indonesia
LQ45
937
1.1
5.8
10.3
Malaysia
KLCI
1,773
1.9
5.1
4.7
Thailand
SET 50
994
(0.7)
(0.5)
9.3
USA
Dow Jones
20,958
1.4
5.5
18.7
UK
FTSE
7,235
(1.9)
1.6
18.3
Japan
Nikkei
19,446
2.8
2.1
10.7
Germany
DAX
12,528
2.7
7.2
25.5
France
CAC
5,301
4.6
10.8
22.8
Source: Bloomberg, Angel Research
Stock Watch
May 04, 2017
Company Name
Reco
CMP
Target
Mkt Cap
Sales ( Čcr )
OPM(%)
EPS (Č)
PER(x)
P/BV(x)
RoE(%)
EV/Sales(x)
(Č)
Price ( Č)
( Č cr )
FY17E
FY18E
FY17E
FY18E
FY17E
FY18E
FY17E
FY18E
FY17E
FY18E
FY17E
FY18E
FY17E
FY18E
Agri / Agri Chemical
Rallis
Neutral
238
-
4,625
1,937
2,164
13.3
14.3
9.0
11.0
26.4
21.6
4.6
4.0
18.4
19.8
2.4
2.1
United Phosphorus
Neutral
812
-
41,268
15,176
17,604
18.5
18.5
37.4
44.6
21.7
18.2
4.3
3.5
21.4
21.2
2.8
2.4
Auto & Auto Ancillary
Amara Raja Batteries
Buy
874
1,009
14,927
5,305
6,100
16.0
16.3
28.4
34.0
30.8
25.7
5.9
5.0
19.3
19.3
2.8
2.4
Apollo Tyres
Neutral
245
-
12,466
12,877
14,504
14.3
13.9
21.4
23.0
11.4
10.7
1.8
1.5
16.4
15.2
1.1
1.0
Ashok Leyland
Buy
83
111
23,592
20,021
21,915
11.6
11.9
4.5
5.3
18.4
15.6
3.8
3.3
20.6
21.5
1.1
1.0
Bajaj Auto
Neutral
2,924
-
84,599
25,093
27,891
19.5
19.2
143.9
162.5
20.3
18.0
5.7
4.9
30.3
29.4
3.1
2.7
Bharat Forge
Neutral
1,149
-
26,742
7,726
8,713
20.5
21.2
35.3
42.7
32.5
26.9
6.0
5.4
18.9
20.1
3.5
3.1
Ceat
Neutral
1,650
-
6,672
7,524
8,624
13.0
12.7
131.1
144.3
12.6
11.4
2.3
2.0
19.8
18.6
1.0
0.8
Eicher Motors
Neutral
25,915
-
70,515
16,583
20,447
17.5
18.0
598.0
745.2
43.3
34.8
14.8
11.3
41.2
38.3
4.1
3.2
Exide Industries
Neutral
222
-
18,904
7,439
8,307
15.0
15.0
8.1
9.3
27.5
23.9
3.8
3.4
14.3
16.7
2.2
1.9
Gabriel India
Neutral
124
-
1,780
1,544
1,715
9.0
9.3
5.4
6.3
22.9
19.7
4.3
3.8
18.9
19.5
1.1
1.0
Hero Motocorp
Neutral
3,368
-
67,261
28,083
30,096
15.3
15.7
171.8
187.0
19.6
18.0
6.8
5.8
30.1
27.9
2.2
2.0
Indag Rubber
Neutral
224
-
588
286
326
19.8
16.8
11.7
13.3
19.2
16.8
3.2
3.0
17.8
17.1
1.7
1.5
Jamna Auto Industries
Neutral
237
-
1,892
1,486
1,620
9.8
9.9
15.0
17.2
15.8
13.8
3.5
2.9
21.8
21.3
1.3
1.2
JK Tyres
Neutral
179
-
4,053
7,455
8,056
15.0
15.0
21.8
24.5
8.2
7.3
1.7
1.4
22.8
21.3
0.7
0.6
L G Balakrishnan & Bros Neutral
642
-
1,007
1,302
1,432
11.6
11.9
43.7
53.0
14.7
12.1
2.1
1.9
13.8
14.2
0.9
0.8
Mahindra and Mahindra Neutral
1,347
-
83,680
46,534
53,077
11.6
11.7
67.3
78.1
20.0
17.3
3.3
2.8
15.4
15.8
1.8
1.5
Maruti
Neutral
6,650
-
200,889
67,822
83,288
16.0
16.4
253.8
312.4
26.2
21.3
6.0
4.9
23.0
22.9
2.6
2.1
Minda Industries
Neutral
497
-
4,296
2,728
3,042
9.0
9.1
68.2
86.2
7.3
5.8
1.7
1.3
23.8
24.3
1.6
1.4
Motherson Sumi
Neutral
405
-
56,767
45,896
53,687
7.8
8.3
13.0
16.1
31.0
25.1
10.0
8.0
34.7
35.4
1.3
1.1
Rane Brake Lining
Neutral
1,003
-
794
511
562
11.3
11.5
28.1
30.9
35.7
32.5
5.5
5.0
15.3
15.0
1.7
1.6
Setco Automotive
Neutral
42
-
554
741
837
13.0
13.0
15.2
17.0
2.7
2.4
0.4
0.4
15.8
16.3
1.1
1.0
Subros
Neutral
236
-
1,415
1,488
1,681
11.7
11.9
6.4
7.2
36.9
32.9
3.9
3.5
10.8
11.4
1.2
1.0
Swaraj Engines
Neutral
1,829
-
2,272
660
810
15.2
16.4
54.5
72.8
33.6
25.1
10.5
9.5
31.5
39.2
3.3
2.6
Tata Motors
Neutral
447
-
128,963
300,209
338,549
8.9
8.4
42.7
54.3
10.5
8.2
1.7
1.4
15.6
17.2
0.5
0.5
TVS Motor
Neutral
499
-
23,714
13,390
15,948
6.9
7.1
12.8
16.5
39.1
30.2
9.7
7.7
26.3
27.2
1.8
1.5
Capital Goods
ACE
Neutral
63
-
624
709
814
4.1
4.6
1.4
2.1
45.1
30.1
1.9
1.8
4.4
6.0
1.0
0.9
BEML
Neutral
1,370
-
5,706
3,451
4,055
6.3
9.2
31.4
57.9
43.6
23.7
2.6
2.4
6.3
10.9
1.8
1.5
BGR Energy
Neutral
160
-
1,156
16,567
33,848
6.0
5.6
7.8
5.9
20.5
27.2
1.2
1.1
4.7
4.2
0.2
0.1
Stock Watch
May 04, 2017
Company Name
Reco
CMP
Target
Mkt Cap
Sales ( Čcr )
OPM(%)
EPS (Č)
PER(x)
P/BV(x)
RoE(%)
EV/Sales(x)
(Č)
Price ( Č)
( Č cr )
FY17E
FY18E
FY17E
FY18E
FY17E
FY18E
FY17E
FY18E
FY17E
FY18E
FY17E
FY18E
FY17E
FY18E
Capital Goods
Bharat Electronics
Neutral
179
-
39,948
8,137
9,169
16.8
17.2
58.7
62.5
3.1
2.9
0.5
0.4
44.6
46.3
3.9
3.5
BHEL
Neutral
174
-
42,613
28,797
34,742
-
2.8
2.3
6.9
75.7
25.2
1.3
1.2
1.3
4.8
1.1
0.8
Blue Star
Accumulate
681
760
6,507
4,283
5,077
5.9
7.3
14.9
22.1
45.7
30.8
8.9
7.5
20.4
26.4
1.6
1.3
CG Power and Industrial
Neutral
77
-
4,823
5,777
6,120
5.9
7.0
3.3
4.5
23.3
17.1
1.0
1.0
4.4
5.9
0.8
0.7
Solutions
Greaves Cotton
Neutral
171
-
4,186
1,755
1,881
16.8
16.9
7.8
8.5
22.0
20.2
4.4
4.1
20.6
20.9
2.1
1.9
Inox Wind
Neutral
200
-
4,443
5,605
6,267
15.7
16.4
24.8
30.0
8.1
6.7
2.3
1.7
25.9
24.4
0.8
0.7
KEC International
Neutral
216
-
5,556
9,294
10,186
7.9
8.1
9.9
11.9
21.8
18.2
3.2
2.8
15.6
16.3
0.8
0.8
KEI Industries
Accumulate
216
239
1,682
2,682
3,058
10.4
10.0
11.7
12.8
18.4
16.9
3.7
3.1
20.1
18.2
0.8
0.7
Thermax
Neutral
1,030
-
12,275
5,421
5,940
7.3
7.3
25.7
30.2
40.1
34.1
4.9
4.4
12.2
13.1
2.1
2.0
VATech Wabag
Neutral
684
-
3,734
3,136
3,845
8.9
9.1
26.0
35.9
26.3
19.1
3.3
2.8
13.4
15.9
1.1
0.9
Voltas
Neutral
416
-
13,755
6,511
7,514
7.9
8.7
12.9
16.3
32.2
25.5
5.8
5.1
16.7
18.5
1.9
1.6
Cement
ACC
Neutral
1,609
-
30,220
11,225
13,172
13.2
16.9
44.5
75.5
36.2
21.3
3.4
3.2
11.2
14.2
2.7
2.3
Ambuja Cements
Neutral
243
-
48,202
9,350
10,979
18.2
22.5
5.8
9.5
41.9
25.6
3.5
3.2
10.2
12.5
5.2
4.4
India Cements
Neutral
211
-
6,486
4,364
4,997
18.5
19.2
7.9
11.3
26.7
18.7
1.9
1.9
8.0
8.5
2.2
2.0
J K Lakshmi Cement
Neutral
469
-
5,522
2,913
3,412
14.5
19.5
7.5
22.5
62.6
20.9
3.9
3.2
12.5
18.0
2.5
2.1
JK Cement
Neutral
989
-
6,916
4,398
5,173
15.5
17.5
31.2
55.5
31.7
17.8
3.8
3.3
12.0
15.5
2.1
1.8
Orient Cement
Neutral
167
-
3,417
2,114
2,558
18.5
20.5
8.1
11.3
20.6
14.8
3.0
2.6
9.0
14.0
2.2
1.8
UltraTech Cement
Neutral
4,303
-
118,129
25,768
30,385
21.0
23.5
111.0
160.0
38.8
26.9
5.0
4.3
13.5
15.8
4.7
3.9
Construction
Engineers India
Neutral
170
-
11,452
1,725
1,935
16.0
19.1
11.4
13.9
14.9
12.2
2.1
2.0
13.4
15.3
5.6
5.0
Gujarat Pipavav Port
Neutral
160
-
7,728
705
788
52.2
51.7
5.0
5.6
32.0
28.5
3.2
2.8
11.2
11.2
10.6
9.0
ITNL
Neutral
114
-
3,744
8,946
10,017
31.0
31.6
8.1
9.1
14.1
12.5
0.5
0.5
4.2
5.0
3.8
3.5
KNR Constructions
Neutral
206
-
2,896
1,385
1,673
14.7
14.0
41.2
48.5
5.0
4.3
0.9
0.8
14.9
15.2
2.2
1.8
Larsen & Toubro
Neutral
1,721
-
160,579
111,017
124,908
11.0
11.0
61.1
66.7
28.2
25.8
3.4
3.1
13.1
12.9
2.5
2.3
MEP Infra
Neutral
69
-
1,116
1,877
1,943
30.6
29.8
3.0
4.2
22.9
16.4
11.1
7.5
0.6
0.6
2.0
1.8
Nagarjuna Const.
Neutral
98
-
5,456
8,842
9,775
9.1
8.8
5.3
6.4
18.5
15.3
1.5
1.3
8.2
9.1
0.8
0.7
NBCC
Neutral
200
-
18,032
7,428
9,549
7.9
8.6
8.2
11.0
24.4
18.2
1.2
1.0
28.2
28.7
2.1
1.6
PNC Infratech
Neutral
159
-
4,071
2,350
2,904
13.1
13.2
9.0
8.8
17.6
18.0
0.6
0.6
15.9
13.9
1.9
1.5
Power Mech Projects
Neutral
581
-
855
1,801
2,219
12.7
14.6
72.1
113.9
8.1
5.1
1.5
1.3
16.8
11.9
0.5
0.4
Sadbhav Engineering
Neutral
324
-
5,563
3,598
4,140
10.3
10.6
9.0
11.9
36.0
27.3
3.8
3.3
9.9
11.9
1.8
1.6
Stock Watch
May 04, 2017
Company Name
Reco
CMP
Target
Mkt Cap
Sales ( Čcr )
OPM(%)
EPS (Č)
PER(x)
P/BV(x)
RoE(%)
EV/Sales(x)
(Č)
Price ( Č)
( Č cr )
FY17E
FY18E
FY17E
FY18E
FY17E
FY18E
FY17E
FY18E
FY17E
FY18E
FY17E
FY18E
FY17E
FY18E
Construction
Simplex Infra
Neutral
419
-
2,075
6,829
7,954
10.5
10.5
31.4
37.4
13.4
11.2
1.4
1.3
9.9
13.4
0.7
0.6
SIPL
Neutral
101
-
3,554
1,036
1,252
65.5
66.2
(8.4)
(5.6)
3.8
4.3
(22.8)
(15.9)
11.6
9.7
Financials
Axis Bank
Buy
501
580
119,956
46,932
53,575
3.5
3.4
32.4
44.6
15.5
11.2
2.0
1.7
13.6
16.5
-
-
Bank of Baroda
Neutral
190
-
43,721
19,980
23,178
1.8
1.8
11.5
17.3
16.5
11.0
1.9
1.6
8.3
10.1
-
-
Can Fin Homes
Neutral
2,805
-
7,467
420
526
3.5
3.5
86.5
107.8
32.4
26.0
7.0
5.7
23.6
24.1
-
-
Canara Bank
Neutral
368
-
21,968
15,225
16,836
1.8
1.8
14.5
28.0
25.4
13.1
1.8
1.4
5.8
8.5
-
-
Cholamandalam Inv. &
Accumulate
1,093
1,230
17,085
2,012
2,317
6.3
6.3
42.7
53.6
25.6
20.4
4.1
3.5
16.9
18.3
-
-
Fin. Co.
Dewan Housing Finance Buy
444
520
13,916
2,225
2,688
2.9
2.9
29.7
34.6
15.0
12.8
2.4
1.6
16.1
14.8
-
-
Equitas Holdings
Buy
162
235
5,468
939
1,281
11.7
11.5
5.8
8.2
27.9
19.7
2.4
2.1
10.9
11.5
-
-
Federal Bank
Accumulate
112
125
19,315
8,259
8,995
3.0
3.0
4.3
5.6
26.1
20.0
2.2
2.0
8.5
10.1
-
-
HDFC
Neutral
1,571
-
249,587
11,475
13,450
3.4
3.4
45.3
52.5
34.7
29.9
6.7
5.9
20.2
20.5
-
-
HDFC Bank
Accumulate
1,541
1,650
395,355
46,097
55,433
4.5
4.5
58.4
68.0
26.4
22.7
4.6
3.9
18.8
18.6
-
-
ICICI Bank
Buy
273
315
158,889
42,800
44,686
3.1
3.3
18.0
21.9
15.2
12.5
2.1
1.9
11.1
12.3
-
-
Karur Vysya Bank
Buy
121
140
7,294
5,640
6,030
3.3
3.2
8.9
10.0
13.6
12.1
1.4
1.3
11.2
11.4
-
-
Lakshmi Vilas Bank
Neutral
180
-
3,451
3,339
3,799
2.7
2.8
11.0
14.0
16.4
12.9
1.7
1.6
11.2
12.7
-
-
LIC Housing Finance
Neutral
707
-
35,665
3,712
4,293
2.6
2.5
39.0
46.0
18.1
15.4
3.4
2.9
19.9
20.1
-
-
Punjab Natl.Bank
Neutral
174
-
37,080
23,532
23,595
2.3
2.4
6.8
12.6
25.6
13.8
4.0
2.8
3.3
6.5
-
-
RBL Bank
Neutral
589
-
22,105
1,783
2,309
2.6
2.6
12.7
16.4
46.4
35.9
5.1
4.5
12.8
13.3
-
-
Repco Home Finance
Accumulate
757
825
4,735
388
457
4.5
4.2
30.0
38.0
25.2
19.9
4.2
3.5
18.0
19.2
-
-
South Ind.Bank
Neutral
26
-
4,615
6,435
7,578
2.5
2.5
2.7
3.1
9.5
8.3
1.2
1.0
10.1
11.2
-
-
St Bk of India
Neutral
289
-
234,659
88,650
98,335
2.6
2.6
13.5
18.8
21.4
15.4
2.0
1.8
7.0
8.5
-
-
Union Bank
Neutral
179
-
12,278
13,450
14,925
2.3
2.3
25.5
34.5
7.0
5.2
1.0
0.9
7.5
10.2
-
-
Yes Bank
Neutral
1,632
-
74,508
8,978
11,281
3.3
3.4
74.0
90.0
22.1
18.1
4.2
3.6
17.0
17.2
-
-
FMCG
Akzo Nobel India
Neutral
1,998
-
9,581
2,955
3,309
13.3
13.7
57.2
69.3
35.0
28.8
11.4
9.6
32.7
33.3
3.0
2.7
Asian Paints
Neutral
1,116
-
107,037
17,128
18,978
16.8
16.4
19.1
20.7
58.4
53.9
20.3
19.2
34.8
35.5
6.2
5.6
Britannia
Neutral
3,574
-
42,889
9,594
11,011
14.6
14.9
80.3
94.0
44.5
38.0
18.3
14.1
41.2
-
4.3
3.7
Colgate
Neutral
1,034
-
28,118
4,605
5,149
23.4
23.4
23.8
26.9
43.4
38.4
24.0
18.8
64.8
66.8
6.0
5.4
Dabur India
Accumulate
276
304
48,583
8,315
9,405
19.8
20.7
8.1
9.2
34.1
30.0
9.5
7.9
31.6
31.0
5.5
4.8
GlaxoSmith Con*
Neutral
5,136
-
21,601
4,350
4,823
21.2
21.4
179.2
196.5
28.7
26.2
7.6
6.5
27.1
26.8
4.3
3.8
Stock Watch
May 04, 2017
Company Name
Reco
CMP
Target
Mkt Cap
Sales ( Čcr )
OPM(%)
EPS (Č)
PER(x)
P/BV(x)
RoE(%)
EV/Sales(x)
(Č)
Price ( Č)
( Č cr )
FY17E FY18E
FY17E
FY18E
FY17E
FY18E
FY17E
FY18E
FY17E
FY18E
FY17E
FY18E
FY17E
FY18E
FMCG
Godrej Consumer
Neutral
1,806
-
61,519
10,235
11,428
18.4
18.6
41.1
44.2
44.0
40.9
9.8
8.2
24.9
24.8
6.1
5.4
HUL
Neutral
934
-
202,183
35,252
38,495
17.8
17.8
20.7
22.4
45.2
41.7
43.2
37.1
95.6
88.9
5.6
5.1
ITC
Neutral
277
-
336,725
40,059
44,439
38.3
39.2
9.0
10.1
30.9
27.4
8.6
7.5
27.8
27.5
7.9
7.1
Marico
Neutral
315
-
40,637
6,430
7,349
18.8
19.5
6.4
7.7
49.2
40.9
14.9
12.5
33.2
32.5
6.1
5.3
Nestle*
Neutral
6,705
-
64,645
10,073
11,807
20.7
21.5
124.8
154.2
53.7
43.5
22.1
19.8
34.8
36.7
6.2
5.3
Procter & Gamble
Neutral
7,360
-
23,892
2,939
3,342
23.2
23.0
146.2
163.7
50.3
45.0
12.7
10.6
25.3
23.5
7.7
6.7
Hygiene
Tata Global
Neutral
156
-
9,858
8,675
9,088
9.8
9.8
7.4
8.2
21.1
19.1
1.7
1.6
7.9
8.1
1.1
1.0
IT
HCL Tech^
Buy
834
1,000
118,967
49,242
57,168
20.5
20.5
55.7
64.1
15.0
13.0
3.0
2.3
20.3
17.9
2.3
1.9
Infosys
Buy
936
1,179
214,914
68,484
73,963
26.0
26.0
63.0
64.0
14.9
14.6
3.1
2.9
20.8
19.7
2.8
2.5
TCS
Accumulate
2,337
2,651
460,568
117,966
127,403
27.5
27.6
134.3
144.5
17.4
16.2
5.2
4.8
29.8
29.7
3.6
3.3
Tech Mahindra
Buy
420
600
40,888
29,673
32,937
15.5
17.0
32.8
39.9
12.8
10.5
2.5
2.2
19.6
20.7
1.1
0.9
Wipro
Accumulate
496
570
120,670
55,421
58,536
20.3
20.3
35.1
36.5
14.1
13.6
2.5
2.1
19.2
14.6
1.6
1.4
Media
D B Corp
Neutral
375
-
6,889
2,297
2,590
27.4
28.2
21.0
23.4
17.8
16.0
4.2
3.6
23.7
23.1
2.8
2.4
Hindustan Media
Neutral
286
-
2,096
1,016
1,138
24.3
25.2
27.3
30.1
10.5
9.5
2.0
1.8
16.2
15.8
1.4
1.2
Ventures
HT Media
Neutral
82
-
1,903
2,693
2,991
12.6
12.9
7.9
9.0
10.4
9.1
0.9
0.8
7.8
8.3
0.3
0.2
Jagran Prakashan
Accumulate
196
225
6,406
2,355
2,635
28.0
28.0
10.8
12.5
18.1
15.7
3.9
3.4
21.7
21.7
2.7
2.4
Sun TV Network
Neutral
881
-
34,721
2,850
3,265
70.1
71.0
26.2
30.4
33.6
29.0
8.6
7.6
24.3
25.6
11.8
10.1
TV Today Network
Buy
266
344
1,589
567
645
26.7
27.0
15.4
18.1
17.3
14.7
2.6
2.2
14.9
15.2
2.4
2.0
Metals & Mining
Coal India
Neutral
279
-
173,404
84,638
94,297
21.4
22.3
24.5
27.1
11.4
10.3
4.7
4.5
42.6
46.0
1.6
1.4
Hind. Zinc
Neutral
265
-
111,908
14,252
18,465
55.9
48.3
15.8
21.5
16.8
12.3
2.7
2.4
17.0
20.7
7.9
6.1
Hindalco
Neutral
197
-
44,182
107,899
112,095
7.4
8.2
9.2
13.0
21.4
15.2
1.0
1.0
4.8
6.6
0.9
0.9
JSW Steel
Neutral
193
-
46,725
53,201
58,779
16.1
16.2
130.6
153.7
1.5
1.3
0.2
0.2
14.0
14.4
1.6
1.4
NMDC
Neutral
128
-
40,624
6,643
7,284
44.4
47.7
7.1
7.7
18.1
16.7
1.6
1.5
8.8
9.2
3.9
3.5
SAIL
Neutral
61
-
25,338
47,528
53,738
(0.7)
2.1
(1.9)
2.6
23.6
0.7
0.6
(1.6)
3.9
1.4
1.3
Tata Steel
Neutral
441
-
42,797
121,374
121,856
7.2
8.4
18.6
34.3
23.7
12.9
1.5
1.4
6.1
10.1
1.0
1.0
Vedanta
Neutral
240
-
71,182
71,744
81,944
19.2
21.7
13.4
20.1
17.9
12.0
1.5
1.4
8.4
11.3
1.4
1.1
Oil & Gas
Cairn India
#VALUE!
9,127
10,632
4.3
20.6
8.8
11.7
3.3
4.2
GAIL
Neutral
426
-
72,117
56,220
65,198
9.3
10.1
27.1
33.3
15.7
12.8
1.4
1.3
9.3
10.7
1.5
1.2
Indian Oil Corp
Neutral
442
-
214,582
373,359
428,656
5.9
5.5
54.0
59.3
8.2
7.5
1.3
1.1
16.0
15.6
0.7
0.6
Stock Watch
May 04, 2017
Company Name
Reco
CMP
Target
Mkt Cap
Sales ( Čcr )
OPM(%)
EPS (Č)
PER(x)
P/BV(x)
RoE(%)
EV/Sales(x)
(Č)
Price ( Č)
( Č cr )
FY17E FY18E
FY17E
FY18E
FY17E
FY18E
FY17E
FY18E
FY17E
FY18E
FY17E
FY18E
FY17E
FY18E
Oil & Gas
ONGC
Neutral
191
-
245,051
137,222
152,563
15.0
21.8
19.5
24.1
9.8
7.9
0.8
0.8
8.5
10.1
2.1
1.8
Reliance Industries
Neutral
1,370
-
445,514
301,963
358,039
12.1
12.6
87.7
101.7
15.6
13.5
1.6
1.5
10.7
11.3
2.0
1.6
Pharmaceuticals
Alembic Pharma
Accumulate
606
689
11,419
3,483
4,244
20.2
21.4
24.3
33.6
24.9
18.0
5.7
4.5
25.5
25.3
3.2
2.6
Alkem Laboratories Ltd
Accumulate
1,991
2,257
23,800
6,065
7,009
18.7
20.0
80.2
92.0
24.8
21.6
5.6
4.7
22.5
21.6
3.9
3.3
Aurobindo Pharma
Buy
584
877
34,230
15,720
18,078
23.7
23.7
41.4
47.3
14.1
12.4
3.7
2.9
29.6
26.1
2.4
2.1
Aventis*
Neutral
4,226
-
9,732
2,277
2,597
16.6
17.4
128.9
157.0
32.8
26.9
5.6
4.3
21.6
26.4
4.1
3.3
Cadila Healthcare
Neutral
454
-
46,452
10,429
12,318
17.7
21.6
13.1
19.2
34.6
23.6
7.3
5.8
22.8
27.1
4.5
3.7
Cipla
Sell
554
465
44,594
15,378
18,089
15.7
16.8
19.3
24.5
28.7
22.6
3.4
3.0
12.3
13.9
3.1
2.6
Dishman Pharma
Sell
306
143
4,935
1,718
1,890
22.7
22.8
9.5
11.3
32.2
27.1
3.1
2.8
10.1
10.9
3.3
2.9
Dr Reddy's
Neutral
2,594
-
42,973
16,043
18,119
18.0
23.0
78.6
130.9
33.0
19.8
3.2
2.8
10.1
15.2
2.4
2.4
GSK Pharma*
Neutral
2,422
-
20,513
2,800
3,290
10.2
20.6
32.2
60.3
75.2
40.2
13.9
13.8
17.2
34.5
7.1
6.1
Indoco Remedies
Accumulate
222
240
2,043
1,112
1,289
16.2
18.2
11.6
16.0
19.1
13.9
3.1
2.6
17.0
20.1
2.0
1.6
Ipca labs
Accumulate
563
613
7,103
3,258
3,747
12.8
15.3
12.1
19.2
46.5
29.3
2.9
2.7
6.4
9.5
2.3
2.0
Lupin
Buy
1,264
1,809
57,096
15,912
18,644
26.4
26.7
58.1
69.3
21.8
18.2
4.2
3.5
21.4
20.9
3.7
3.0
Natco Pharma
Accumulate
889
974
15,496
2,090
2,335
32.1
26.6
26.8
23.2
33.1
38.4
9.4
8.1
28.4
21.1
7.5
91.8
Sun Pharma
Buy
627
847
150,528
31,129
35,258
32.0
32.9
30.2
35.3
20.8
17.8
3.4
2.8
20.0
20.1
4.4
3.7
Power
NTPC
Neutral
162
-
133,659
86,605
95,545
17.5
20.8
11.8
13.4
13.7
12.1
1.4
1.3
10.5
11.1
2.9
2.9
Power Grid
Accumulate
211
223
110,256
25,315
29,193
88.2
88.7
14.2
17.2
14.9
12.3
2.3
2.0
15.2
16.1
9.0
8.1
Tata Power
Neutral
82
-
22,233
36,916
39,557
17.4
27.1
5.1
6.3
16.1
13.1
1.4
1.3
9.0
10.3
1.6
1.5
Real Estate
MLIFE
Accumulate
472
522
1,936
1,152
1,300
22.7
24.6
29.9
35.8
15.8
13.2
1.2
1.1
7.6
8.6
2.4
2.0
Prestige Estate
Neutral
248
-
9,287
4,707
5,105
25.2
26.0
10.3
13.0
24.0
19.1
1.9
1.8
10.3
10.2
3.1
2.8
Telecom
Bharti Airtel
Neutral
346
-
138,490
105,086
114,808
34.5
34.7
12.2
16.4
28.4
21.1
1.9
1.8
6.8
8.4
2.2
1.9
Idea Cellular
Neutral
84
-
30,217
40,133
43,731
37.2
37.1
6.4
6.5
13.1
12.9
1.1
1.0
8.2
7.6
1.8
1.5
zOthers
Abbott India
Neutral
4,121
-
8,758
3,153
3,583
14.1
14.4
152.2
182.7
27.1
22.6
133.0
113.5
25.6
26.1
2.5
2.1
Asian Granito
Neutral
387
-
1,164
1,060
1,169
12.2
12.5
12.7
15.9
30.6
24.4
2.9
2.6
9.5
10.7
1.4
1.2
Bajaj Electricals
Accumulate
349
395
3,535
4,801
5,351
5.7
6.2
10.4
13.7
33.5
25.5
4.1
3.7
12.4
14.5
0.7
0.7
Banco Products (India)
Neutral
232
-
1,661
1,353
1,471
12.3
12.4
14.5
16.3
16.0
14.3
22.1
19.9
14.5
14.6
1.2
125.6
Coffee Day Enterprises
Neutral
256
-
5,270
2,964
3,260
20.5
21.2
4.7
8.0
-
32.0
3.0
2.7
5.5
8.5
2.2
1.9
Ltd
Competent Automobiles Neutral
230
-
147
1,137
1,256
3.1
2.7
28.0
23.6
8.2
9.7
44.2
39.9
14.3
11.5
0.1
0.1
Stock Watch
May 04, 2017
Company Name
Reco
CMP
Target
Mkt Cap
Sales ( Čcr )
OPM(%)
EPS (Č)
PER(x)
P/BV(x)
RoE(%)
EV/Sales(x)
(Č)
Price ( Č)
( Č cr )
FY17E
FY18E
FY17E
FY18E
FY17E
FY18E
FY17E
FY18E
FY17E
FY18E
FY17E
FY18E
FY17E
FY18E
zOthers
Elecon Engineering
Neutral
60
-
676
1,482
1,660
13.7
14.5
3.9
5.8
15.5
10.4
3.6
3.3
7.8
10.9
0.8
0.7
Finolex Cables
Neutral
529
-
8,090
2,883
3,115
12.0
12.1
14.2
18.6
37.3
28.4
19.8
17.3
15.8
14.6
2.5
2.3
Garware Wall Ropes
Neutral
784
-
1,716
863
928
15.1
15.2
36.4
39.4
21.5
19.9
3.9
3.3
17.5
15.9
1.9
1.8
Goodyear India*
Neutral
894
-
2,061
1,598
1,704
10.4
10.2
49.4
52.6
18.1
17.0
83.5
73.3
18.2
17.0
1.0
139.2
Hitachi
Neutral
1,782
-
4,845
2,081
2,433
8.8
8.9
33.4
39.9
53.4
44.7
43.0
35.9
22.1
21.4
2.3
2.0
HSIL
Neutral
345
-
2,497
2,384
2,515
15.8
16.3
15.3
19.4
22.6
17.8
22.4
19.3
7.8
9.3
1.2
1.1
Interglobe Aviation
Neutral
1,116
-
40,342
21,122
26,005
14.5
27.6
110.7
132.1
10.1
8.5
60.3
43.1
168.5
201.1
1.9
1.5
Jyothy Laboratories
Neutral
376
-
6,839
1,440
2,052
11.5
13.0
8.5
10.0
44.3
37.6
10.7
9.9
18.6
19.3
5.0
3.5
Kirloskar Engines India
Neutral
402
-
5,812
2,554
2,800
9.9
10.0
10.5
12.1
38.3
33.2
16.0
15.1
10.7
11.7
1.9
1.7
Ltd
Linc Pen & Plastics
Neutral
293
-
433
382
420
9.3
9.5
13.5
15.7
21.7
18.6
3.7
3.2
17.1
17.3
1.2
1.1
M M Forgings
Neutral
630
-
761
546
608
20.4
20.7
41.3
48.7
15.3
12.9
86.3
76.4
16.6
17.0
1.2
1.1
Manpasand Bever.
Neutral
697
-
3,989
836
1,087
19.6
19.4
16.9
23.8
41.3
29.3
5.0
4.3
12.0
14.8
4.5
3.4
Mirza International
Neutral
116
-
1,393
963
1,069
17.2
18.0
6.1
7.5
18.9
15.4
2.9
2.5
15.0
15.7
1.7
1.5
MT Educare
Neutral
81
-
323
366
417
17.7
18.2
9.4
10.8
8.7
7.5
1.9
1.7
22.2
22.3
0.8
0.7
Narayana Hrudaya
Neutral
316
-
6,458
1,873
2,166
11.5
11.7
2.6
4.0
119.5
79.7
7.3
6.6
6.1
8.3
3.5
3.1
Navkar Corporation
Buy
215
265
3,065
369
561
42.9
42.3
6.9
11.5
31.1
18.7
2.2
2.0
7.4
10.5
9.3
6.1
Navneet Education
Neutral
169
-
3,944
1,062
1,147
24.0
24.0
6.1
6.6
27.7
25.5
5.7
5.0
20.6
19.8
3.8
3.5
Nilkamal
Neutral
2,185
-
3,261
1,995
2,165
10.7
10.4
69.8
80.6
31.3
27.1
124.9
108.5
16.6
16.5
1.6
1.5
Page Industries
Neutral
14,714
-
16,411
2,450
3,124
20.1
17.6
299.0
310.0
49.2
47.5
327.7
250.2
47.1
87.5
6.7
5.3
Parag Milk Foods
Neutral
238
-
2,001
1,919
2,231
9.3
9.6
9.5
12.9
25.2
18.4
3.9
3.2
15.5
17.5
1.2
1.0
Quick Heal
Neutral
247
-
1,732
408
495
27.3
27.0
7.7
8.8
31.9
28.1
3.0
3.0
9.3
10.6
3.4
2.8
Radico Khaitan
Buy
123
147
1,639
1,667
1,824
13.0
13.2
6.7
8.2
18.5
15.1
1.7
1.5
9.0
10.2
1.4
1.2
Relaxo Footwears
Neutral
490
-
5,883
2,085
2,469
9.2
8.2
7.6
8.0
64.8
61.6
25.1
21.4
17.9
18.8
2.9
2.5
S H Kelkar & Co.
Neutral
312
-
4,514
1,036
1,160
15.1
15.0
6.1
7.2
51.1
43.5
5.5
5.0
10.7
11.5
4.2
3.7
Siyaram Silk Mills
Accumulate
1,696
1,872
1,590
1,652
1,857
11.6
11.7
92.4
110.1
18.3
15.4
2.7
2.3
14.7
15.2
1.2
1.0
Styrolution ABS India*
Neutral
726
-
1,277
1,440
1,537
9.2
9.0
40.6
42.6
17.9
17.0
45.7
41.5
12.3
11.6
0.8
0.7
Surya Roshni
Neutral
275
-
1,206
3,342
3,625
7.8
7.5
17.3
19.8
15.9
13.9
30.2
24.3
10.5
10.8
0.6
0.6
Team Lease Serv.
Neutral
1,092
-
1,867
3,229
4,001
1.5
1.8
22.8
32.8
48.0
33.3
5.1
4.5
10.7
13.4
0.5
0.4
The Byke Hospitality
Neutral
211
-
845
287
384
20.5
20.5
7.6
10.7
27.7
19.7
5.8
4.7
20.7
23.5
3.0
2.2
Stock Watch
May 04, 2017
Company Name
Reco
CMP
Target Mkt Cap
Sales ( Čcr )
OPM(%)
EPS (Č)
PER(x)
P/BV(x)
RoE(%)
EV/Sales(x)
(Č)
Price ( Č)
( Č cr )
FY17E FY18E FY17E FY18E FY17E FY18E FY17E FY18E FY17E FY18E FY17E FY18E FY17E FY18E
zOthers
Transport Corporation of
Neutral
256
-
1,960
2,671
2,911
8.5
8.8
13.9
15.7
18.5
16.4
2.5
2.3
13.7
13.8
0.8
0.8
India
TVS Srichakra
Neutral
4,137
-
3,168
2,304
2,614
13.7
13.8
231.1
266.6
17.9
15.5
464.8
366.0
33.9
29.3
1.4
1.2
UFO Moviez
Neutral
440
-
1,214
619
685
33.2
33.4
30.0
34.9
14.7
12.6
2.0
1.8
13.8
13.9
1.7
1.3
Visaka Industries
Neutral
328
-
520
1,051
1,138
10.3
10.4
21.0
23.1
15.6
14.2
42.0
39.3
9.0
9.2
0.8
0.7
VRL Logistics
Neutral
339
-
3,093
1,902
2,119
16.7
16.6
14.6
16.8
23.3
20.1
5.1
4.5
21.9
22.2
1.7
1.5
Wonderla Holidays
Neutral
381
-
2,153
287
355
38.0
40.0
11.3
14.2
33.7
26.8
4.8
4.2
21.4
23.9
7.2
5.8
VIP Industries
Neutral
209
-
2,955
1,270
1,450
10.4
10.4
5.6
6.5
37.3
32.2
7.7
6.8
20.7
21.1
2.3
2.0
Navin Fluorine
Buy
3,027
3,650
2,963
789
945
21.1
22.4
120.1
143.4
25.2
21.1
4.1
3.5
17.8
18.5
3.7
3.0
Source: Company, Angel Research; Note: *December year end; #September year end; &October year end; Price as on May 03, 2017
Market Outlook
May 04, 2017
Research Team Tel: 022 - 39357800
DISCLAIMER
Angel Broking Private Limited (hereinafter referred to as “Angel”) is a registered Member of National Stock Exchange of India
Limited,Bombay Stock Exchange Limited and Metropolitan Stock Exchange Limited. It is also registered as a Depository Participant with
CDSL and Portfolio Manager with SEBI. It also has registration with AMFI as a Mutual Fund Distributor. Angel Broking Private Limited is a
registered entity with SEBI for Research Analyst in terms of SEBI (Research Analyst) Regulations, 2014 vide registration number
INH000000164. Angel or its associates has not been debarred/ suspended by SEBI or any other regulatory authority for accessing
/dealing in securities Market. Angel or its associates/analyst has not received any compensation / managed or
co-managed public offering of securities of the company covered by Analyst during the past twelve months.
This document is solely for the personal information of the recipient, and must not be singularly used as the basis of any investment
decision. Nothing in this document should be construed as investment or financial advice. Each recipient of this document should make
such investigations as they deem necessary to arrive at an independent evaluation of an investment in the securities of the companies
referred to in this document (including the merits and risks involved), and should consult their own advisors to determine the merits and
risks of such an investment.
Reports based on technical and derivative analysis center on studying charts of a stock's price movement, outstanding positions and
trading volume, as opposed to focusing on a company's fundamentals and, as such, may not match with a report on a company's
fundamentals. Investors are advised to refer the Fundamental and Technical Research Reports available on our website to evaluate the
contrary view, if any.
The information in this document has been printed on the basis of publicly available information, internal data and other reliable
sources believed to be true, but we do not represent that it is accurate or complete and it should not be relied on as such, as this
document is for general guidance only. Angel Broking Pvt. Limited or any of its affiliates/ group companies shall not be in any way
responsible for any loss or damage that may arise to any person from any inadvertent error in the information contained in this report.
Angel Broking Pvt. Limited has not independently verified all the information contained within this document. Accordingly, we cannot
testify, nor make any representation or warranty, express or implied, to the accuracy, contents or data contained within this document.
While Angel Broking Pvt. Limited endeavors to update on a reasonable basis the information discussed in this material, there may be
regulatory, compliance, or other reasons that prevent us from doing so.
This document is being supplied to you solely for your information, and its contents, information or data may not be reproduced,
redistributed or passed on, directly or indirectly.
Neither Angel Broking Pvt. Limited, nor its directors, employees or affiliates shall be liable for any loss or damage that may arise from
or in connection with the use of this information.